Scientific Visualization – Infographic Modul December 2019
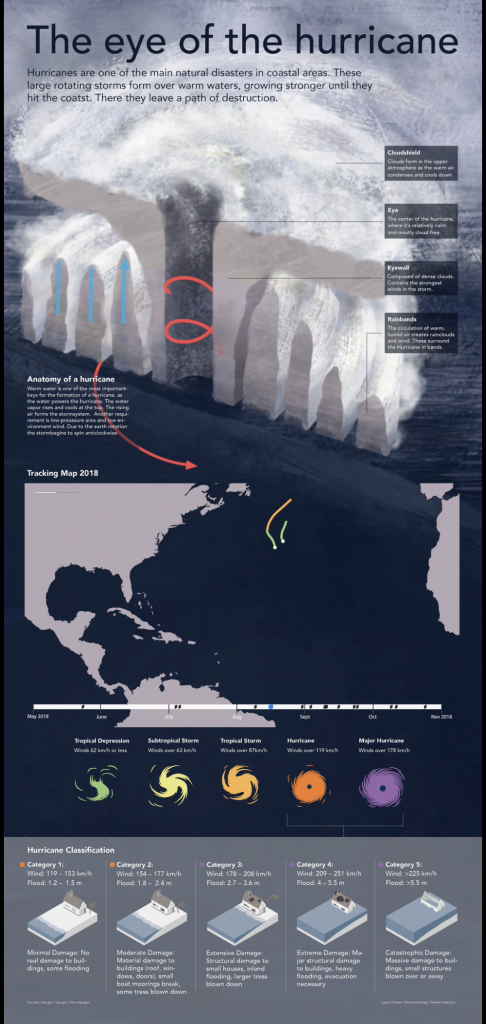
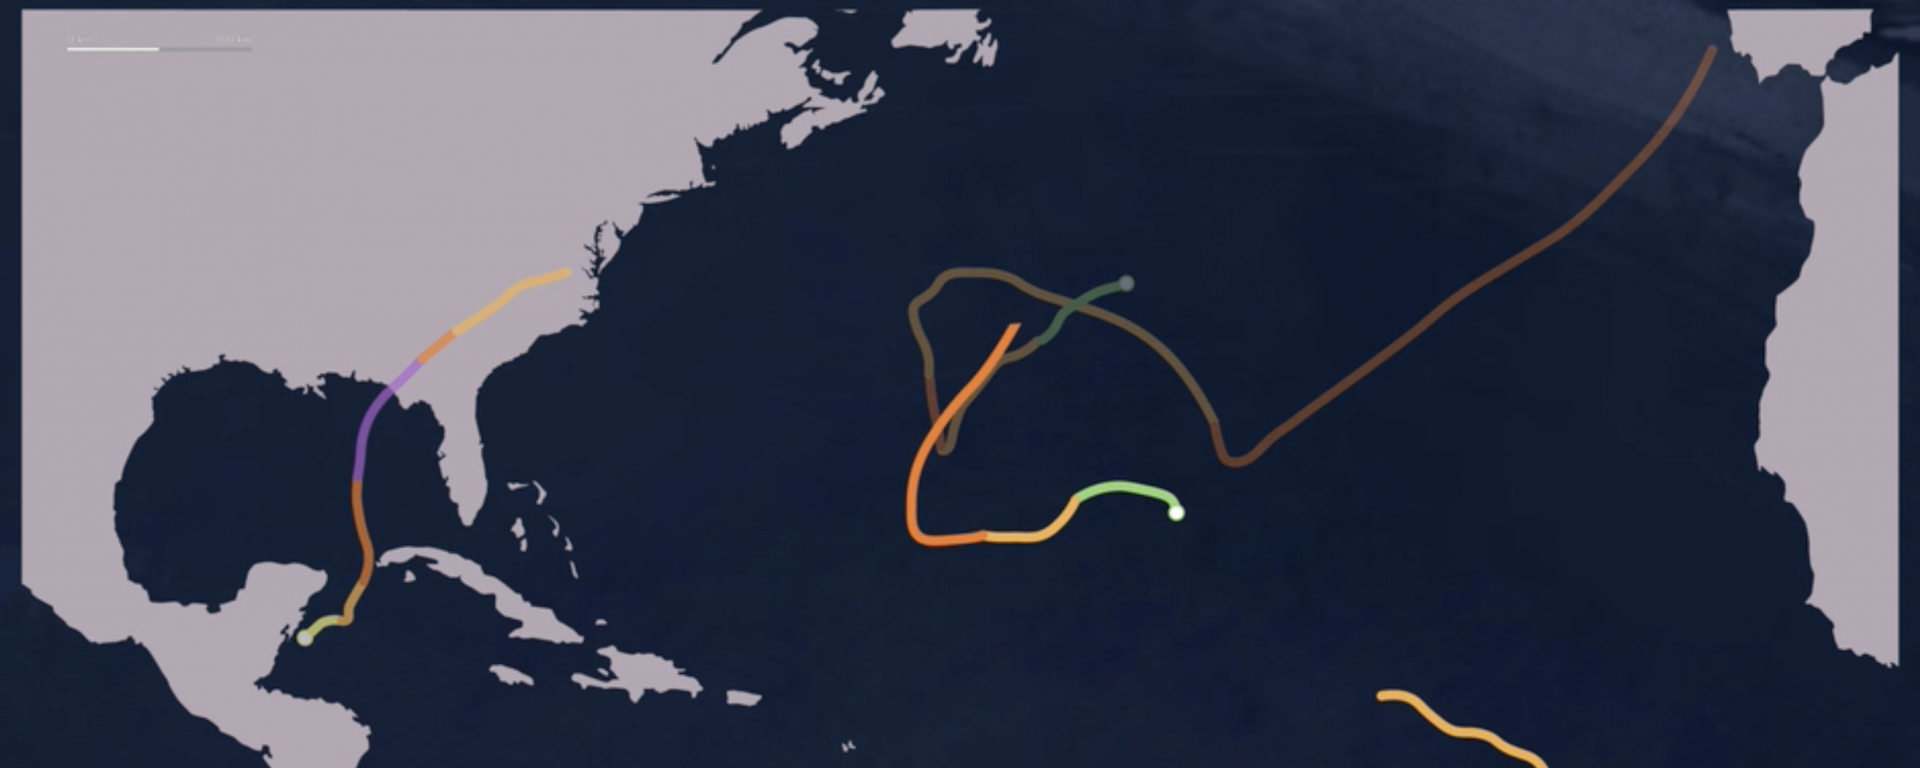
Our Hurricane infographic is structured in three parts. At the top the structure, temperature and the wind current is marked, in the middle you can see a timeline from May to November 2018 and at the bottom the strength of the destruction of a hurricane depending on the category.
Made by Tamara Trabucco – Laura Cincera – Anna-Lea Krieg